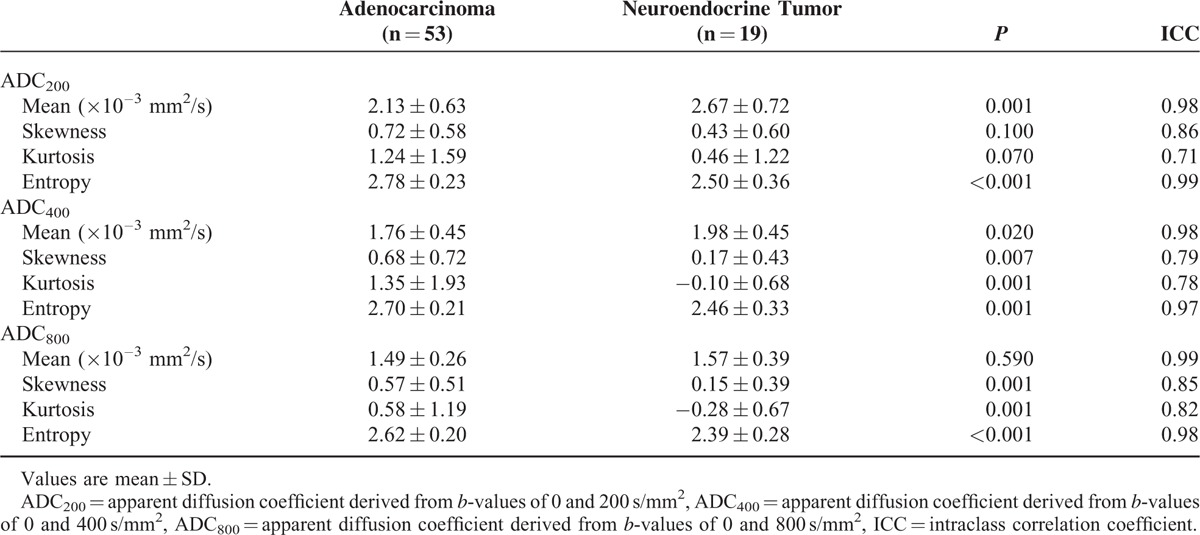
TABLE 2.
Histogram Analysis of Apparent Diffusion Coefficient Values Derived From b-Values of 0 and 200, 0 and 400, and 0 and 800 s/mm2

Histogram Analysis of Apparent Diffusion Coefficient Values Derived From b-Values of 0 and 200, 0 and 400, and 0 and 800 s/mm2
