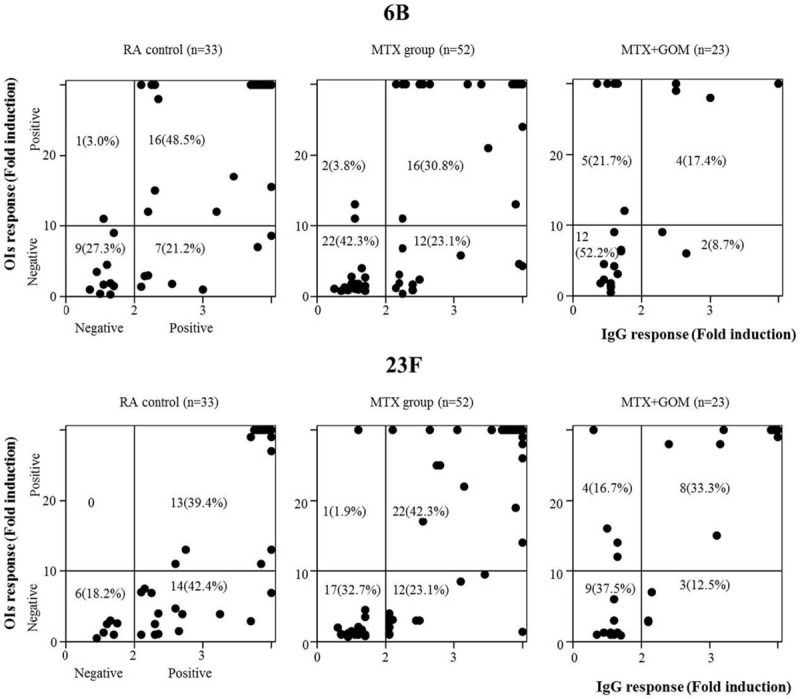
FIGURE 4.

Relationship between IgG and OIs responses after PPSV23 vaccination. The responses 6B (upper panel) and 23F (lower panel) serotype-specific IgG (X-axis) and OIs (Y axis) responses were plotted in the comparison of three groups (control, MTX, MTX + GOM). Positive OIs responses were demonstrated in patients receiving MTX plus GOM with negative IgG responses. GOM = golimumab, MTX = methotrexate, OI = opsonization index.
