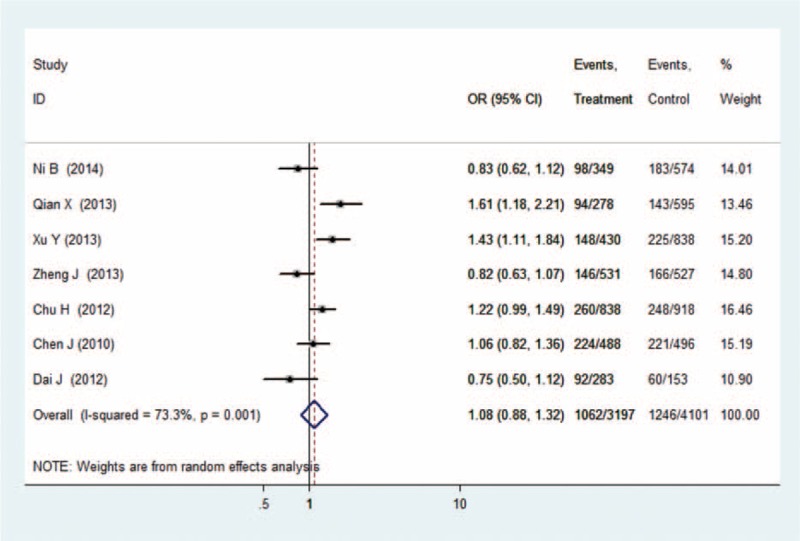
FIGURE 2.

Forest plot of cancer risk related to rs6682925 polymorphism under TT versus CC genetic model. C = the major allele in rs6682925 polymorphism, CI = confidence interval, OR = odds ratio, T = the minor allele in rs6682925 polymorphism.

Forest plot of cancer risk related to rs6682925 polymorphism under TT versus CC genetic model. C = the major allele in rs6682925 polymorphism, CI = confidence interval, OR = odds ratio, T = the minor allele in rs6682925 polymorphism.