
FIGURE 1.
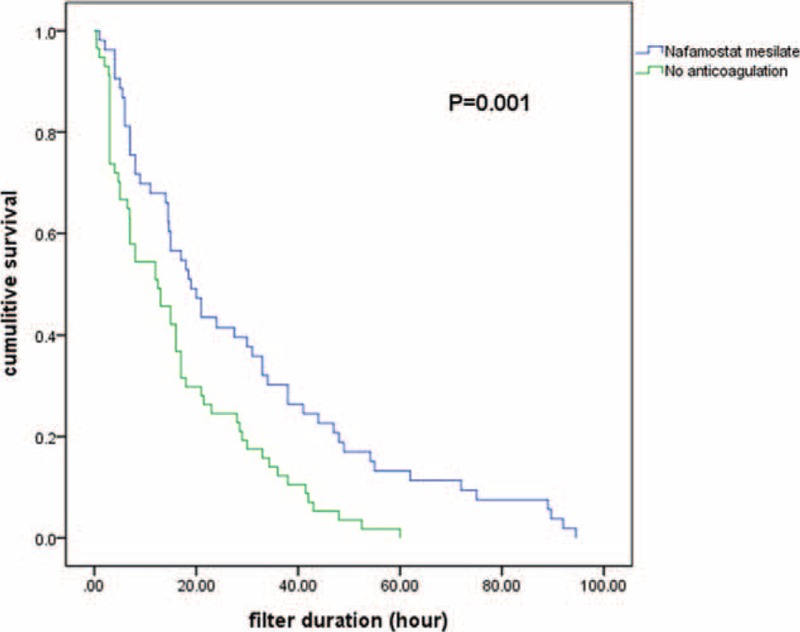
Kaplan–Meier curves comparing duration of hemofilter survival between the nafamostat mesilate and no anticoagulant groups.
Official websites use .gov
A
.gov website belongs to an official
government organization in the United States.
Secure .gov websites use HTTPS
A lock (
) or https:// means you've safely
connected to the .gov website. Share sensitive
information only on official, secure websites.
Kaplan–Meier curves comparing duration of hemofilter survival between the nafamostat mesilate and no anticoagulant groups.