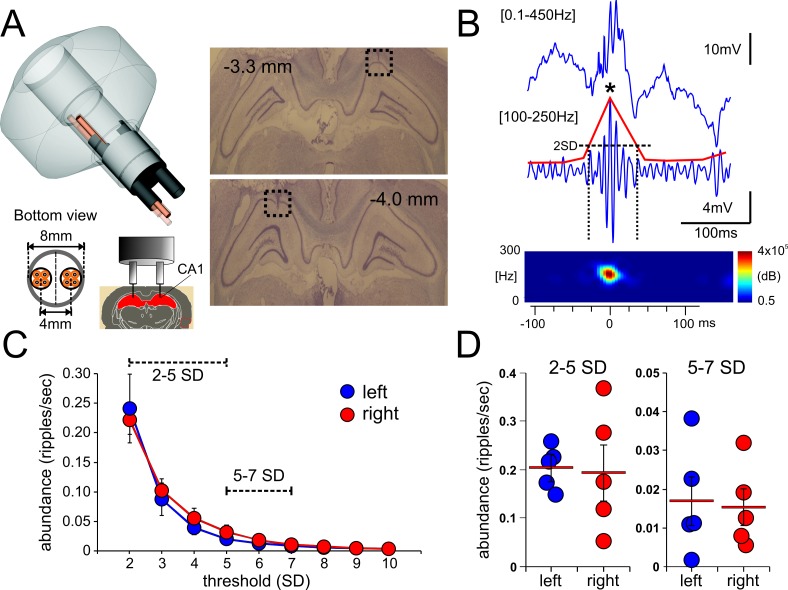
Fig 1. Simultaneous recording of ripple events from the left and right hippocampi.
A, the left panel shows a scheme of the “split-hyperdrive” utilized for bilateral recording of ripple events. The bottom panel shows the 8-tetrode array (left) and the target location of the recording tetrodes (right). The right panel depicts two coronal slices showing the electrode track and the electrolytic-induced lesion at the tip of the recording tetrode (black dashed square) in the right (top panel, -3.3mm from bregma) and left hemisphere (bottom panel, -4.0mm from bregma). B, representative broad-band recording, showing a detected ripple event (top trace). The bottom trace shows its corresponding filtered signal ([100 – 250Hz], blue trace) with the respective computed power envelope (red trace). The horizontal dotted line indicates the detection threshold while the vertical ones the time at which ripple duration was calculated. The precise time-stamp of the detected ripple event corresponds to the peak of the LFP oscillation (marked with a black asterisk). The lower panel shows the power spectrogram of the detected ripple event. C, ripple abundance throughout the recording session was not significantly different between both hippocampi regardless of the detection threshold utilized, two-way ANOVA p = 0.693. D, for a better analysis, ripple events were grouped into two groups, low amplitude (events between 2-5SD) and high amplitude (events between 5-7SD). Ripple abundance was not statistically different between left and right hippocampi when events were grouped according to their amplitude.

