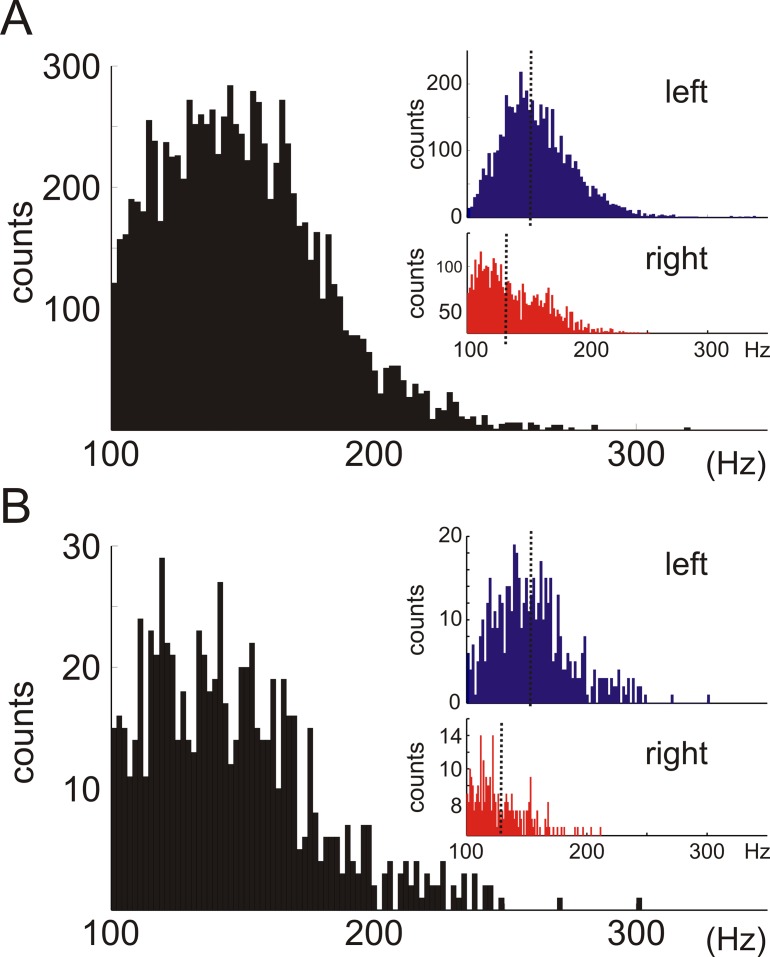
Fig 2. Ripple frequency analysis.
Histograms depicting the distribution of the all the computed individual frequencies. Regardless of the difference in the number of events, there were no statistical differences in the mean ripple frequency values between low and high amplitude events. A, within low amplitude events, the data show differences between the mean frequency value of ripple events obtained from left (blue histogram) and right hippocampus (red histogram). B, within the high amplitude event group, the data also show statistically different mean frequency values between hemispheres.

