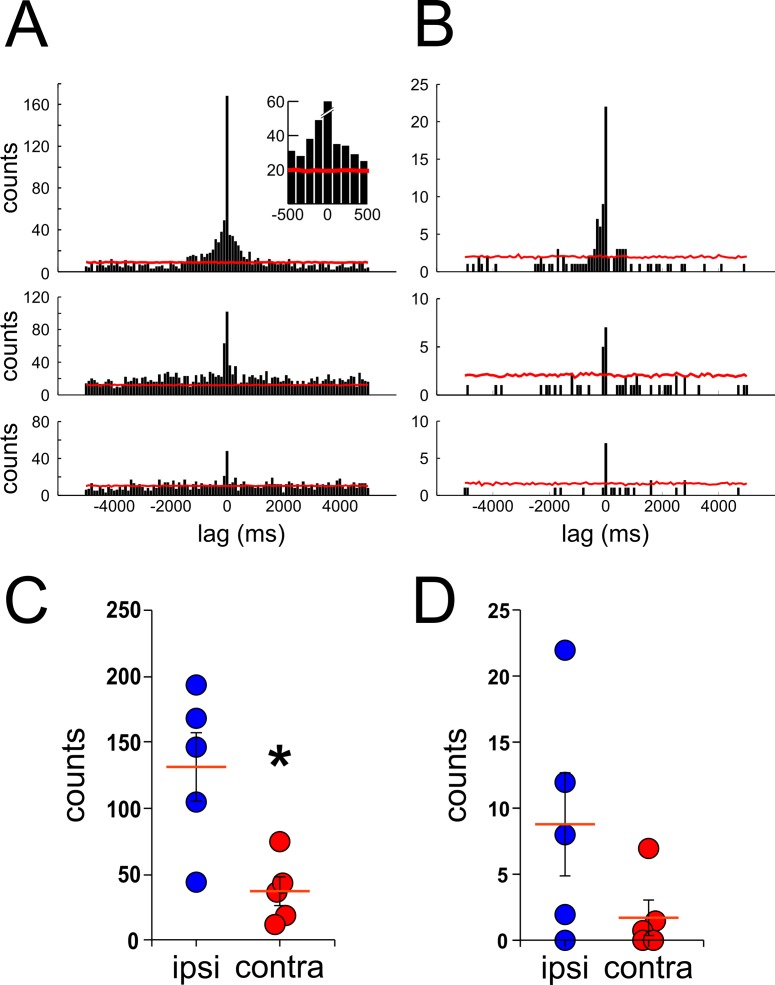
Fig 7. Cross-correlation analysis with a longer time bin.
Similar cross-correlation analysis of ripple events as performed in Fig 6 but with a longer time bin width (100ms) for low amplitude (A) and high amplitude events (B). The red trace represents the significance level (3SD, bootstrapping of inter-ripple times, shuffles = 400). Top panel insert depicts a magnification of the histogram around 0 lag to better show counts over the level of significance. C–D, counts of synchronous ripple events at 0 lag time between ipsi- (blue circles) and contra-lateral (red circles) signals. Each circle represents the averaged count of synchronous events from the cross-correlation analysis of a single recording session from an individual animal. Cross-correlation analysis was performed with ripple events from low amplitude (C) and high amplitude (D) groups, *p<0.05, Mann-Whitney test.

