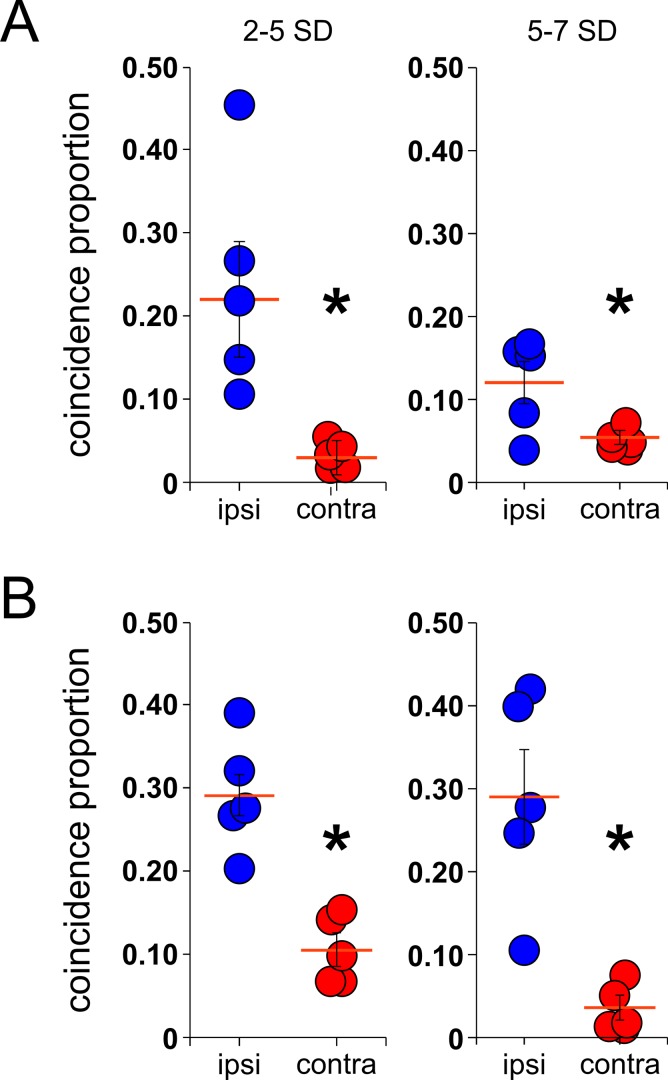
Fig 8. Coincidence proportion of ripple events between ipsi- and contra-lateral hippocampi.
Average of coincidence proportion (number of synchronous ripples/possible events) between ipsi- (blue circles) and contra-lateral (red circles) ripple events from the low amplitude (A) and the high amplitude group (B) for all the animals recorded (n = 5, red line = mean, SEM), *p<0.01, Mann-Whitney test.

