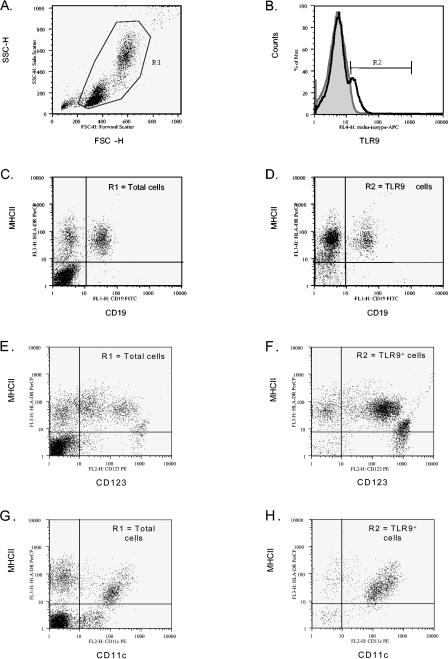
FIG. 2.
Cell surface TLR9 is expressed on human PBMC. (A) A representative dot plot displays forward and side scatters of the PBMC used for live-cell gating (R1). (B) Staining with the TLR9 MAb (dark open line) is shown overlaying staining observed with the isotype control MAb (gray filled line). R2 indicates the cell surface TLR9+ cells. Dot plots of (C, D) MHC class II and CD19, (E, F) MHC class II and CD123, (G, H) MHC class II and CD11c expression are shown for (C, E, G) R1-gated cells and (D, F, H) R2 TLR9+ cells. Dead cells were excluded by 7AAD staining.

