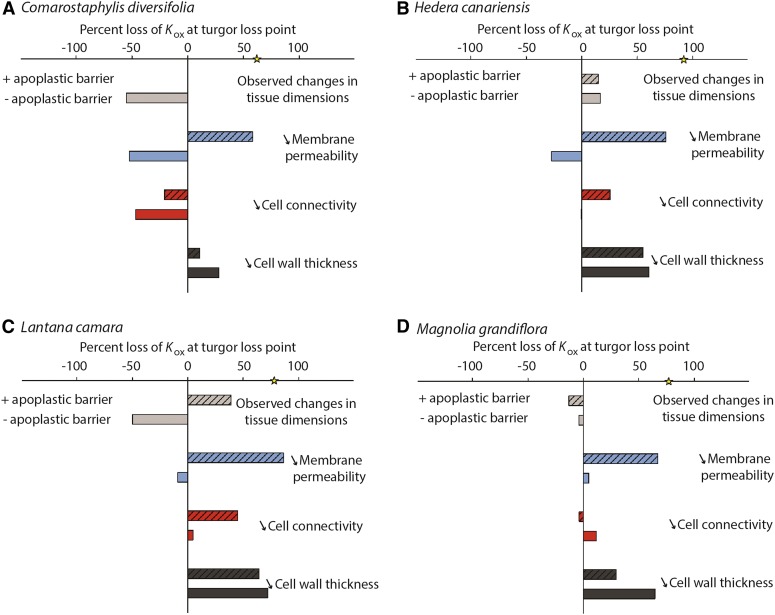
Figure 6.
Testing hypotheses for the potential drivers of the decline in Kox in dehydrating leaves, using a spatially explicit model of leaf outside-xylem water transport (see “Materials and Methods”). Parameterizing the model for four species, we estimated the Kox based on the decline of observed cell size, porosity (air space), and leaf area at the turgor loss point (light gray bars). Because in some cases these changes in tissue dimensions resulted in an increase in Kox, we modeled Kox decline according to three scenarios (always including the observed changes in tissue dimension): an 80% decline at the turgor loss point in membrane permeability (blue bars), cell connectivity (red bars), and cell wall thickness (dark gray bars). All simulations were run with or without an apoplastic barrier at the bundle sheath cells (solid versus striped bars). The yellow star on the x axis represents the observed percentage Kox decline at the turgor loss point. Across all four species, only simulations of a strong decrease in membrane permeability in leaves with an apoplastic barrier could explain the observed declines in Kox.

