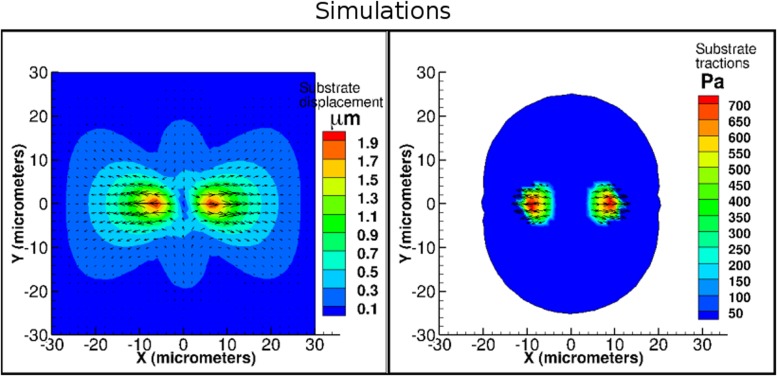
Fig 3. Comparison of simulations to cell spreading in a confined environment.
Our simulations are shown and corresponding experimental results can be found in Fig 3 of Wang et al. [39] (see center and rightmost panel in middle row.) We illustrate numerically computed substrate displacements and FA tractions. FA traction magnitudes are shown as contours and traction vectors are also illustrated. We note that numerical results compare well to experiments both qualitatively and quantitatively. Cell and substrate Young’s modulus: Ec = 0.5 kPa, Es = 1 kPa. FA springs do not rupture.

