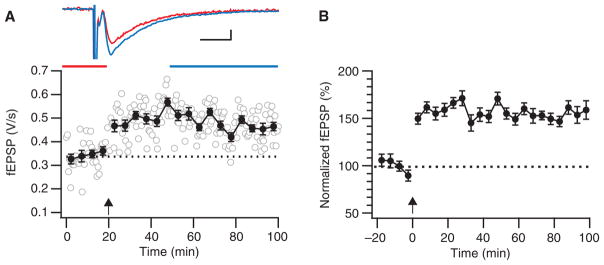
FIGURE 2.
Theta-burst LTP. (A) Sample theta-burst induction experiment showing robust LTP. During the induction (arrow), 12 trains of 4 pulses at 100 Hz were delivered at 5 Hz, and this was repeated three times at 0.1 Hz. Error bars indicate xxx. Inset top: fEPSPs averaged over indicated time periods before (red) and after (blue) induction (scale bars: 100 μV, 5 ms). (B) This ensemble average of five such theta-burst experiments indicates how robust this LTP paradigm is. Before averaging, experiments were normalized to their individual baseline periods, so error bars (S.E.M.) reflect the variability around the mean, not absolute amplitude variability across experiments.

