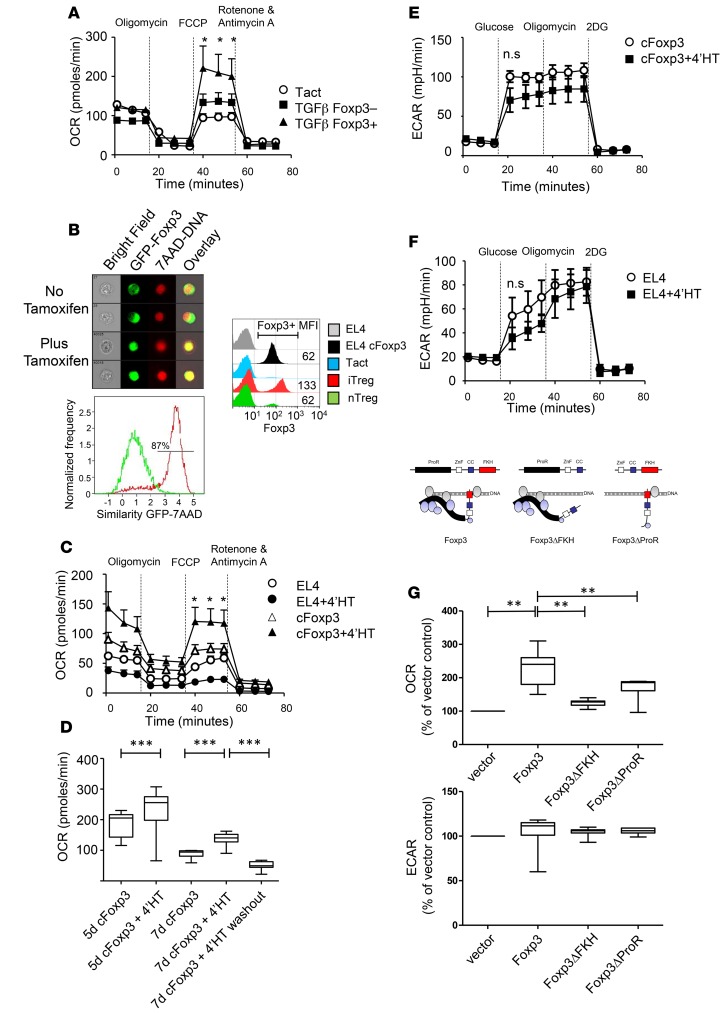
Figure 1. Foxp3 drives an increase in mitochondrial respiration.
(A) Oxygen consumption rate (OCR), a measure of OXPHOS, in flow cytometry–sorted Marilyn.foxp3hCD2 knockin Foxp3+ iTreg compared with Foxp3– cells or Marilyn.foxp3hCD2 knockin T cells activated (Tact) in the absence of TGFβ. Results representative of 3 separate experiments. Means ±SD. *P < 0.05 by 2-way ANOVA. (B) Left panel; EL4.cFoxp3 cells were cultured overnight with or without 50 nM 4’HT. Measurement of nuclear versus cytoplasmic eGFP by Imagestream. The percentage similarity for 7AAD and eGFP (Foxp3) was measured for EL4.cFoxp3 without (green histogram) and with (red histogram) 4’HT treatment. Right panel: Foxp3 expression in EL4, EL4.cFoxp3, Tact, CD4+ T cells from iTreg induction cultures and nTreg. (C) OCR of cFoxp3-expressing EL4 cells with and without 4’HT for 48 hours, compared with EL4 cells without the cFoxp3 construct. Results representative of 3 separate experiments. Means ± SD. *P < 0.05 by 2-way ANOVA. (D) OCR of EL4.cFoxp3 cells cultured for 5 days in the presence or absence of 4’HT (first 2 bars). The cells were washed at day 5 and cultured for a further 2 days with or without (washout) 4’HT. 7d cFoxp3 indicates cells cultured for 7 days without 4’HT; 7d cFoxp3 + 4’HT indicates cells cultured for 7 days with 4’HT. Results representative of 2 separate experiments. Boxes span 25th to 75th percentiles, whiskers represent minimum and maximum values, and horizontal line shows median. ***P < 0.0001 by 2-way ANOVA. (E and F) Extracellular acidification rate (ECAR) in cFoxp3-expressing EL4 cells and EL4 cells without cFoxp3 with or without 4’HT. ECAR in response to glucose, oligomycin, and 2’deoxyglucose (2DG) after 48 hours with or without 4’HT. Results representative of 3 separate experiments. Means ± SD. (G) Top panel: EL4 cells transfected with retroviral constructs encoding Foxp3, Foxp3 lacking the forkhead domain “Foxp3ΔFKH”, or Foxp3 lacking the proline-rich region “Foxp3ΔProR”. Empty vector was used as a negative control. ProR, proline-rich region; ZnF, zinc finger; CC, coiled coil region; FKH, Forkhead region. Middle panel: OCR of EL4 cells transfected with the indicated constructs. Data represent percentage change relative to empty vector, pooled results of 2 separate experiments. **P < 0.005, Student’s t test. Bottom panel: ECAR of EL4 cells transfected with the indicated constructs, pooled results of 2 separate experiments. Boxes span 25th to 75th percentiles, whiskers represent minimum and maximum values, and horizontal line shows median.

