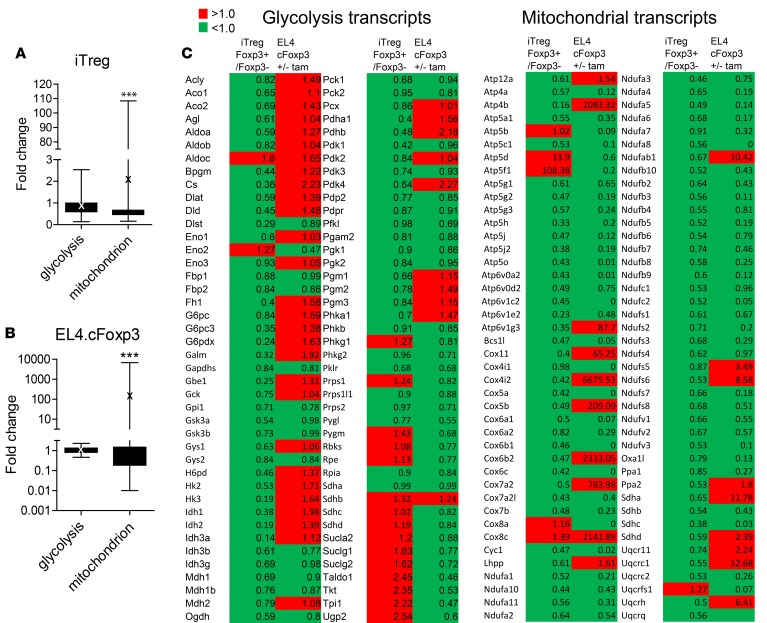
Figure 4. Foxp3 exerts transcriptional control on multiple mitochondrial genes.
Comparison of Foxp3 positive and negative T cells polarized under iTreg conditions and EL4 cells expressing conditional Foxp3 treated with and without tamoxifen by qPCR array. Data for A–C represent the mean of qPCR performed separately on 3 biological replicates, then pooled. (A) Comparison of the fold change of all the glycolytic gene set transcripts with the mitochondrial component gene set transcripts in Foxp3 positive and negative iTreg by 2-way ANOVA. Boxes span 25th to 75th percentiles, whiskers represent minimum and maximum values, and horizontal line shows median. “X” marks mean, ***P < 0.005. (B) Comparison of the fold change of all the glycolytic gene set transcripts with the mitochondrial component gene set transcripts in nuclear Foxp3+ versus cytoplasmic Foxp3+ EL4 T cells by 2-way ANOVA. Boxes span 25th to 75th percentiles, whiskers represent minimum and maximum values, and horizontal line shows median. “X” marks mean, ***P < 0.005. (C) Heat map of qPCR array data. Glycolysis- and mitochondrial-associated genes, as well as their fold changes, are listed. EL4 fold change indicates the ratio of 4’HT to non–4’HT-treated cells. iTreg fold change indicates the ratio of CD2+RAG–/–Marilyn.Foxp3hCD2 to CD2–cells. Red indicates transcripts with a ratio >1.00, and green indicates transcripts with a ratio <1.00. tam, tamoxifen.

