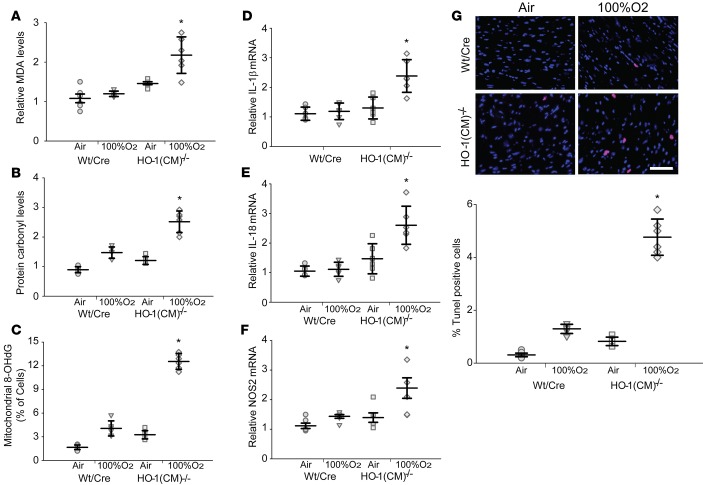
Figure 2. Posthyperoxia oxidative stress, inflammation, and cell death after ablation of cardiac HO-1 in mice.
(A) Cardiac levels of malonaldehyde, (B) cardiac level of carbonylated proteins, and (C) 8- OHdG levels in the 4 groups of mice (mean ± SEM; *P < 0.05 for pre- vs. posthyperoxia; n = 6/ group). (D–F) Inflammatory marker analysis by qPCR for IL-1β, IL-18, and iNOS (NOS2) (mean ± SEM; *P < 0.05 for pre- vs. posthyperoxia; n = 6/group). (G) TUNEL-positive cells in cardiac sections of the 4 groups of mice. Images are overlays of TUNEL-positive nuclei (red) with DAPI stained nuclei (blue). The magenta florescence indicates TUNEL positive cells. Excessive TUNEL staining is observed after tamoxifen in HO-1(CM)–/– mice after hyperoxia compared with the other groups (scale bar = 20 μm). (H) Quantitation of TUNEL positive nuclei in the heart sections (mean ± SEM; horizontal bars represent mean values.*P < 0.05 for pre- vs. posthyperoxia; n = 6/group; 2-way ANOVA).

