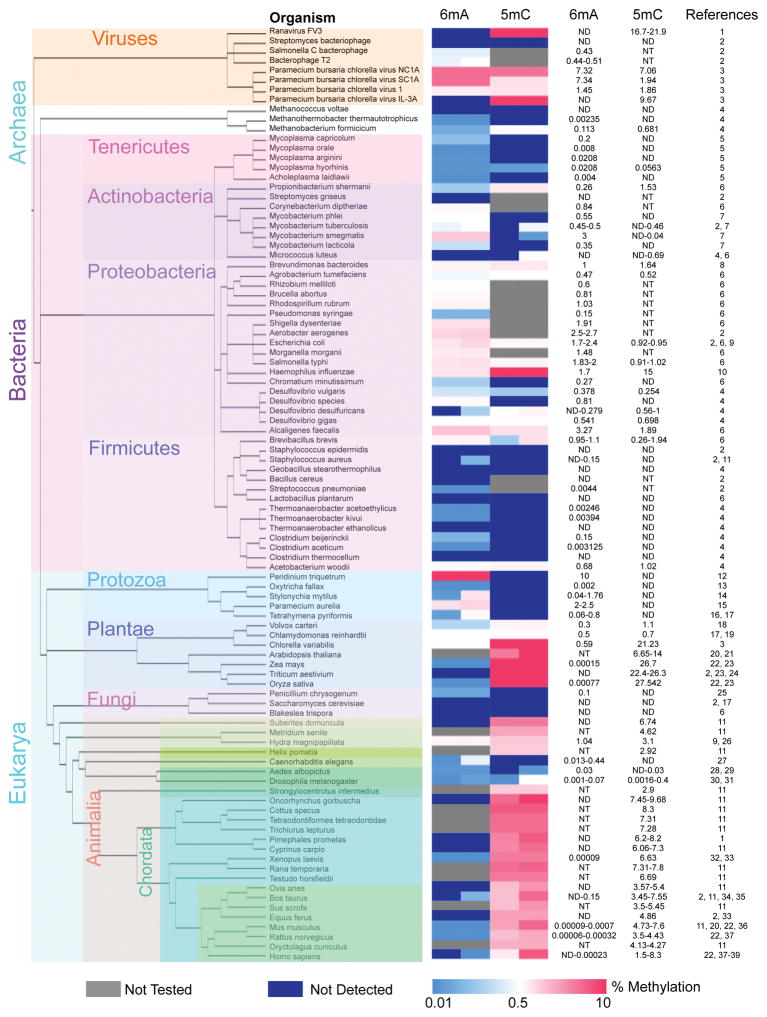
Figure 1. Abundance of 6mA and 5mC across the tree of life.
The relative abundance of 6mA and 5mC are displayed in a heat map. The first column of the heat map displays the percentage of adenines that are N6-methylated (%6mA/A) and the second column displays the percentage of cytosines that are C5-methylated (%5mC/C) for the organism indicated in each row. Blue color represents lower 6mA or 5mC abundance and red color represents higher 6mA or 5mC abundance. Grey color indicates that the methylation mark was not tested in that organism. Dark blue color indicates that the methylation mark was not detected in that organism, and therefore may or may not be present at levels below the limit of detection for the technique used. For some organisms the level of methylation has been shown to vary across multiple measurements, between different studies or between different cell types within the same organism. In such cases, a range is presented where the left half of the column reflects the lowest detected level (or not detected in some cases) and the right half of the column shows the highest detected level. Methylation values are presented on the right along with citations. The phylogenetic tree was generated using the PhyloT web server (http://phylot.biobyte.de/index.html) and visualized using the Interactive Tree Of Life web server (http://itol.embl.de/). The phylogenetic tree (‘rooted’ setting) displays the inferred evolutionary relationships between the indicated genera based on their genetic similarity (Letunic, Bork 2011). The tree was created using FigTree v1.4.2. The different organisms are subdivided into different colored boxes to represent different kingdoms and phyla. For some phyla only one organism has been examined. 1: (Willis, Granoff 1980), 2: (Dunn, Smith 1958), 3: (Van Etten et al. 1985), 4: (Ehrlich et al. 1985), 5: (Razin, Razin 1980), 6: (Vanyushin et al. 1968), 7: (Srivastava et al. 1981), 8: (Degnen, Morris 1973), 9: (Yuki et al. 1979), 10: (Drozdz et al. 2012), 11: (Vanyushin et al. 1970), 12: (Rae 1976), 13: (Rae, Spear 1978), 14: (Ammermann et al. 1981), 15: (Cummings et al. 1974), 16: (Gorovsky et al. 1973), 17: (Hattman et al. 1978), 18: (Babinger et al. 2001), 19: (Fu et al. 2015), 20: (Capuano et al. 2014), 21: (Kakutani et al. 1999), 22: (Huang et al. 2015), 23: (Wagner, Capesius 1981), 24: (Montero et al. 1992), 25: (Rogers et al. 1986), 26: (Hassel et al. 2010), 27: (Greer et al. 2015b), 28: (Adams et al. 1979), 29: (Proffitt et al. 1984), 30: (Zhang et al. 2015), 31: (Lyko et al. 2000), 32: (Koziol et al. 2016), 33: (Jabbari et al. 1997), 34: (Unger, Venner 1966), 35: (Romanov, Vanyushin 1981), 36: (Wu et al. 2016), 37: (Gama-Sosa et al. 1983), 38: (Tawa et al. 1992), 39: (Ehrlich et al. 1982).

