Fig. 9.

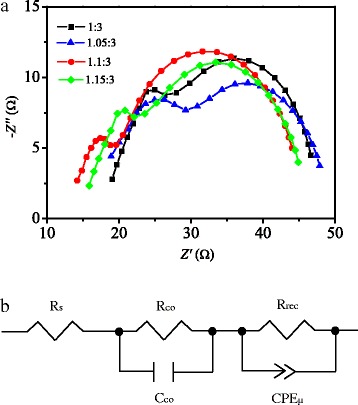
a Typical Nyquist plots for the perovskite solar cells. The simulation result (solid line) is fitted to experimental data (symbols). b Equivalent circuit applied to fit the Nyquist plots

a Typical Nyquist plots for the perovskite solar cells. The simulation result (solid line) is fitted to experimental data (symbols). b Equivalent circuit applied to fit the Nyquist plots