Figure 1.

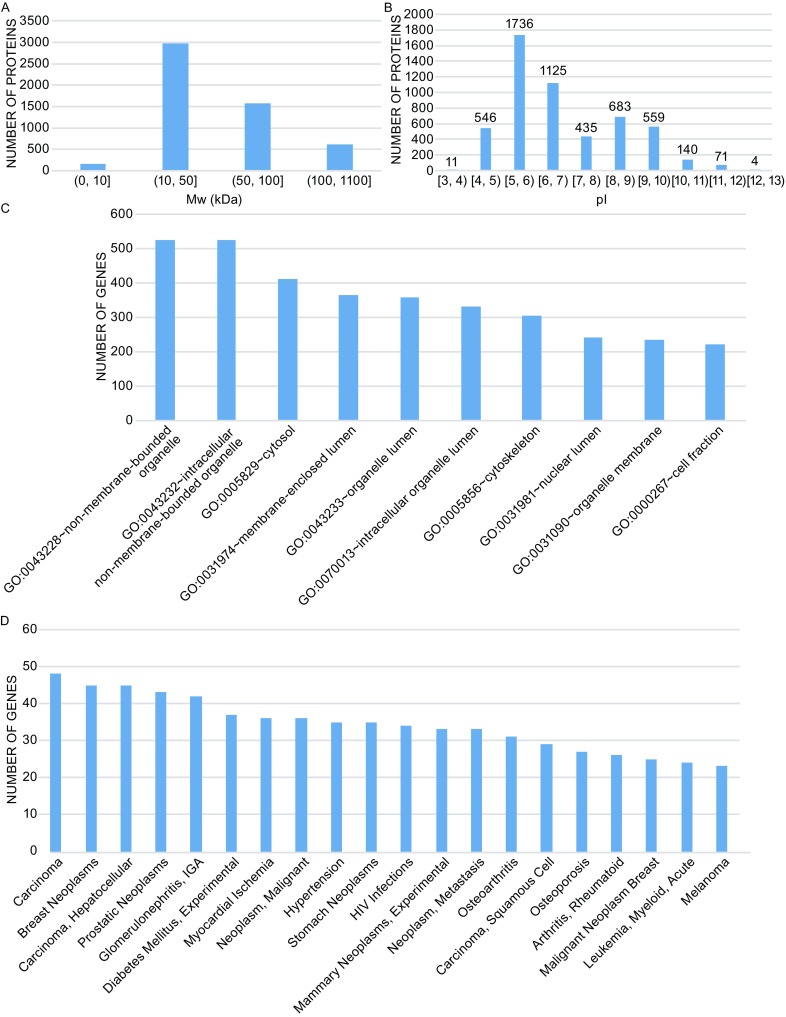
Basic information and disease association of human monocyte proteins. (A) Distribution of protein molecular weight. X-axis lists the specific Mw ranges. Y-axis shows the number of proteins distributed in each range. (B) Distribution of Protein Isoelectric Point. X axis lists the specific pI ranges. Y axis shows the number of proteins distributed in each range. (C) Top 10 terms in cellular component category. X axis shows the top 10 terms in the Cellular Component category. Y axis shows the number of genes enriched in each specific GO term. (D) 20 main diseases related to human monocytes. X axis shows the names of 20 diseases. Y axis shows the number of monocyte-expressed genes involved in each specific disease
