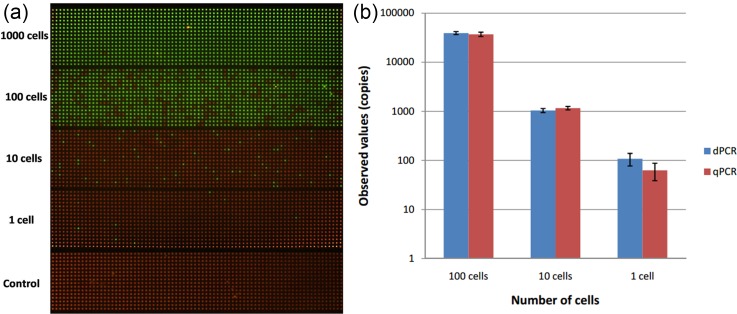
FIG. 3.
Digital PCR and qPCR measurement results of β-actin gene on the different numbers of A549 cells. (a) Digital PCR fluorescence images of β-actin gene of different numbers of cells ranging from 1000 cells to 1 cell and no-template control. At high cell concentrations (1000 cells), target DNA template exceeded the maximum theoretical dynamic range of the SPC digital PCR chip. There is no positive signal in control when no target DNA. (b) Comparison of quantitative results of copy number for β-actin gene from 1000 cells to 1 cell. Bars represent the standard deviation of measurement.

