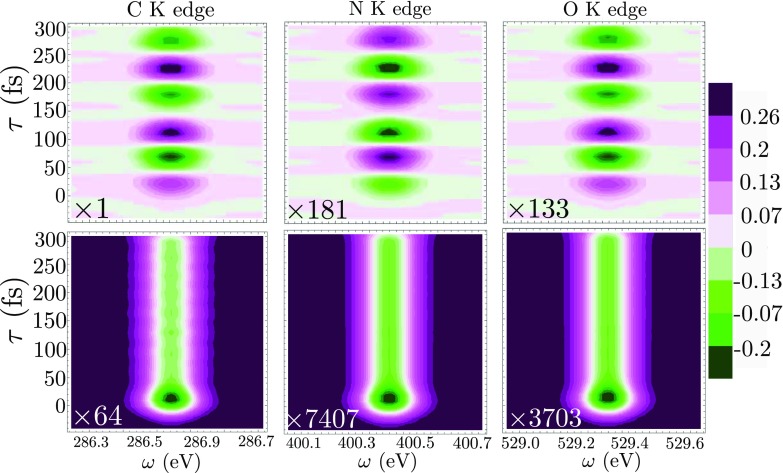
FIG. 6.
Top row: frequency and time resolved CD, Eq. (15), at the C, N, and O K edges of formamide. Bottom row: corresponding frequency resolved pump-probe non-chiral signals, Eq. (17) at the C, N, and O K edges. The color bar indicates the amplitude of the C K-edge CD signal. The spectra are normalized on the same scale and their absolute magnitude is multiplied by the factor on the bottom left of each graph.

