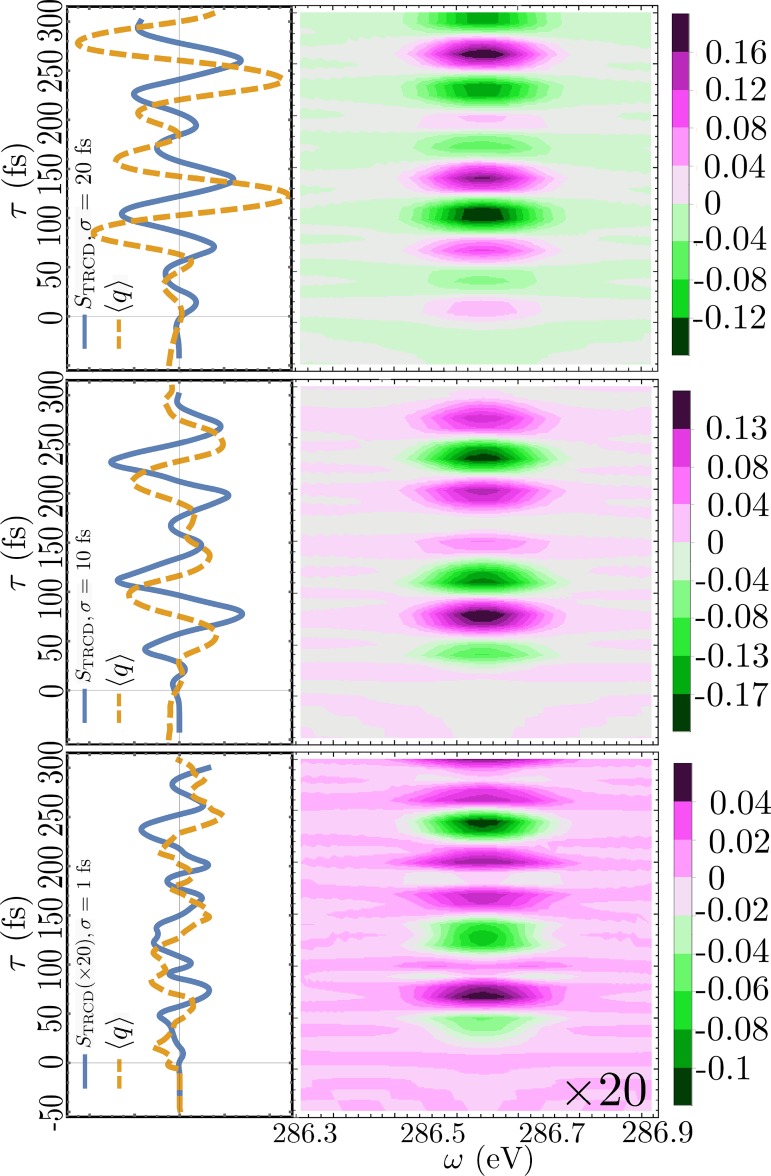
FIG. 9.
Left: TRCD signals at the C K-edge (solid, blue, Eq. (16)) and the expectation value of the normal mode coordinate q (dashed, orange) calculated for three pump durations: σpu = 20, 10, and 1 fs (ωpu = 5.85 eV for all). Right: Corresponding frequency and time resolved signals.

