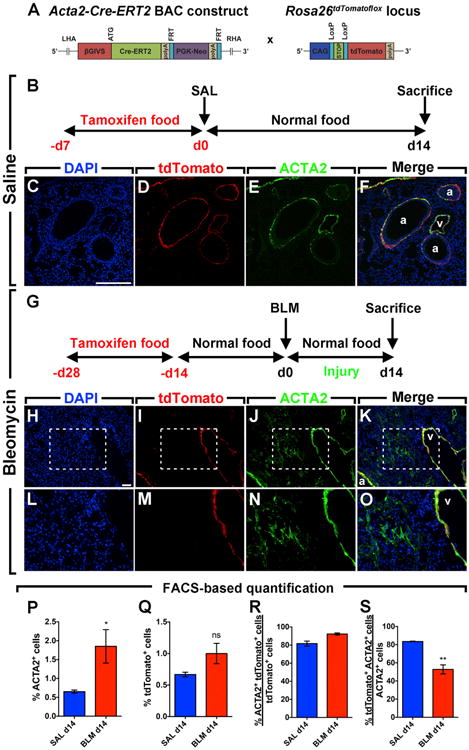
Figure 1. Activated Myofibroblasts Do Not Derive from Pre-existing Smooth Muscle Cells in Lung Fibrosis.

(A) Schematic representation of the Acta2-Cre-ERT2 and tdTomatoflox constructs.
(B) Timeline of tamoxifen and saline treatments. Mice were fed tamoxifen-containing pellets before saline was administered intratracheally. Lungs were harvested at 14 d.p.i.
(C–F) Immunofluorescent staining showing DAPI, tdTomato, and ACTA2 single channels in addition to a merged image.
(G) Timeline of tamoxifen and bleomycin treatments. Mice were fed tamoxifen-containing pellets for 2 weeks followed by 2 weeks of normal pellets before bleomycin was administered intratracheally.
(H–K) Immunofluorescent staining showing DAPI, tdTomato, and ACTA2 single channels in addition to a merged image.
(L–O) High-magnification images of the boxes in (H)–(K).
(P–S) FACS-based quantification of tdTomato+ and ACTA2+ cell populations in saline and bleomycin-treated lungs at 14 d.p.i.
Scale bars: (C)–(F), 250 μm; (H)–(K), 50 μm. a, airway; BLM, bleomycin; ns, not significant; SAL, saline; v, vessel. SAL d14, n = 4; BLM d14, n = 6; n represents biological replicates. Data are presented as mean values ± SEM. *p < 0.05, **p < 0.01.
