
Figure 4. Lipofibroblasts Give Rise to Activated Myofibroblasts during Fibrosis Formation.
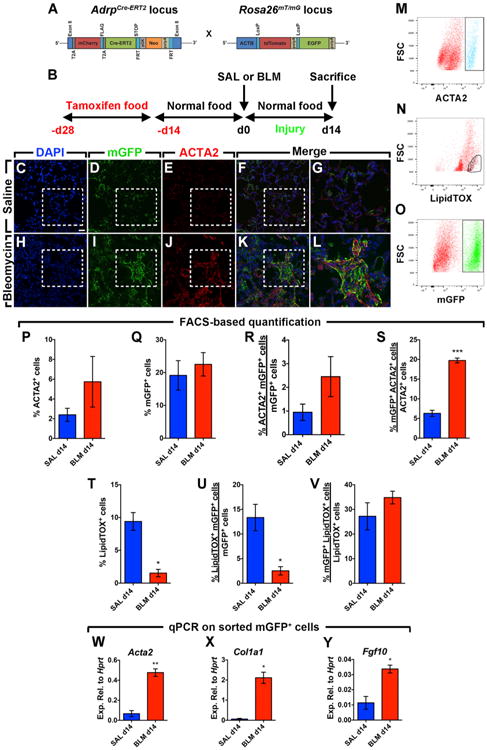
(A) Schematic representation of the AdrpCre-ERT2 and mT/mG constructs.
(B) Timeline of tamoxifen and saline or bleomycin treatments. Mice were fed tamoxifen-containing pellets before saline or bleomycin was administered intratracheally. Lungs were harvested at 14 d.p.i.
(C–F) Immunofluorescent staining of saline-treated lungs showing DAPI, mGFP, and ACTA2 single channels in addition to a merged image.
(G) A high-magnification image of the region marked by the box in the merged image (F).
(H–K) Immunofluorescent staining of bleomycin-treated lungs showing DAPI, mGFP, and ACTA2 single channels in addition to a merged image.
(L) A high-magnification image of the region marked by the box in the merged image (K).
(M–O) Gating strategy for the detection of ACTA2+, LipidTOX+, and mGFP+ cell populations by FACS.
(P–V) FACS-based quantification of ACTA2+, mGFP+, and LipidTOX+ cell populations at 14 d.p.i.
(W–Y) qPCR for Acta2, Col1a1, and Fgf10 on mGFP+ cells sorted from saline- and bleomycin-treated lungs at 14 d.p.i.
Scale bar: 25 μm. SAL d14, n = 3; BLM d14, n = 3–4; n represents biological replicates. Data are presented as mean values ± SEM. *p < 0.05, **p < 0.01, ***p < 0.001.