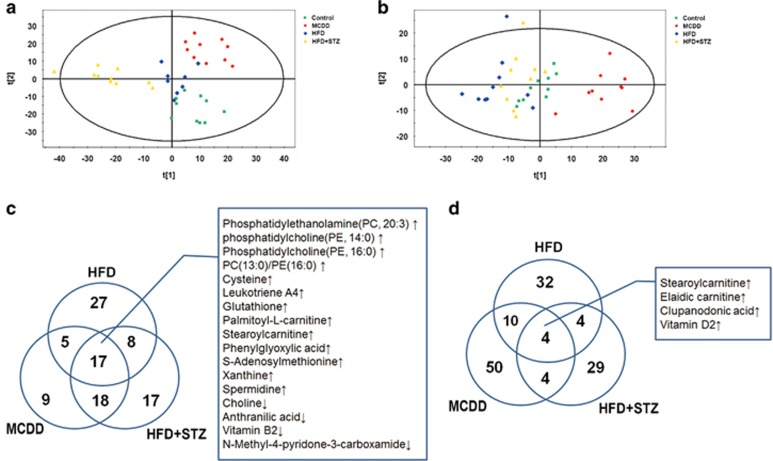
Figure 3.
The metabolomic analysis of liver tissue and serum samples in different phenotypes of NAFLD. The score plot of the principal component analysis that was derived from the ultra-performance liquid chromatography-mass spectrometry (UPLC-MS) spectra of liver tissues (a) and serum (b), indicating discrimination among different groups. Venn diagram illustrates the distinct and overlapping metabolites and lists of metabolites that commonly changed in different phenotypes of NAFLD in liver tissue (c) and serum samples (d) of the rat model groups.

