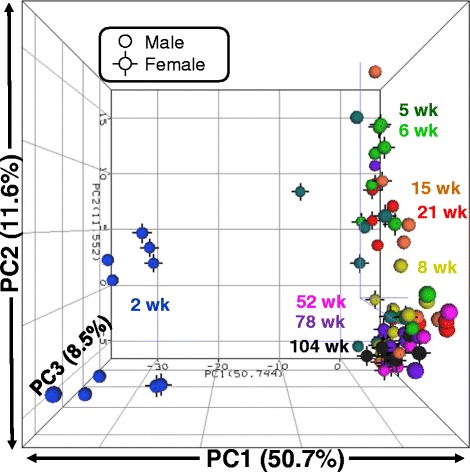
Fig. 1.

PCA plot of differentially expressed miRNA profiles of 88 rat liver samples. Normalized log2 intensity values for 214 miRNAs that were differentially expressed by age and/or sex in livers of rats of nine ages and both sexes are plotted. Each sphere represents the composite DEM profile from a single animal. Colors represent age groups. Black vertices indicate female animals; males have none
