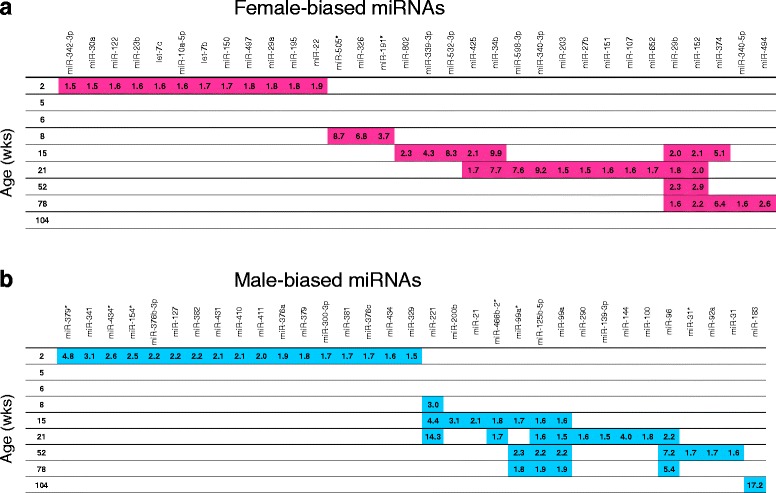
Fig. 3.

Sex-biased miRNA expression at nine ages in the livers of rats. Sex-biased miRNAs are displayed along the horizontal axis for females (a) and males (b). Age of the rats is shown on the vertical axis. Numbers indicate fold-difference in expression of the indicated miRNA, female/male (a) and male/female (b).
