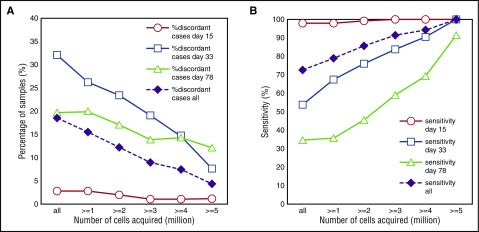
Figure 4.
Performance of FCM-MRD vs PCR-based MRD is dependent on the number of acquired cells. (A) The percentage of discordant cases by FCM-MRD and PCR-MRD is shown for individual time points (day 15, day 33, and day 78) as well as for all samples together. Data are presented for variable numbers of acquired cells: all samples (independent of cell number) and samples with at least 1, 2, 3, 4, or 5 million cells acquired. (B) The sensitivity of FCM-MRD relative to PCR-MRD is shown for individual time points (day 15, day 33, and day 78) as well as for all samples together. Data are presented for variable numbers of acquired cells: all samples (independent of cell number; n = 377) and samples with at least 1 (n = 330), 2 (n = 287), 3 (n = 255), 4 (n = 227), or 5 million cells (n = 191) acquired. Sensitivity is calculated as the number of samples positive by both FCM and PCR divided by the total number of samples positive by PCR (ie, the reference method).

