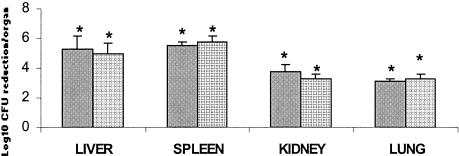
FIG. 3.
Efficacy of eradication of MRSA 32 from multiple organs. The histograms show the reductions of the organism loads per organ 48 h after the end of therapy compared with the organism loads in the untreated controls at the start of treatment. Bars indicate standard deviations. Results that are significantly different (P < 0.05) from those for the controls are indicated with an asterisk. Bars on the left for each organ, vancomycin at 20 mg/kg twice a day for 2 days; bars on the right for each organ, WCK 771 at 50 mg/kg twice a day for 2 days.

