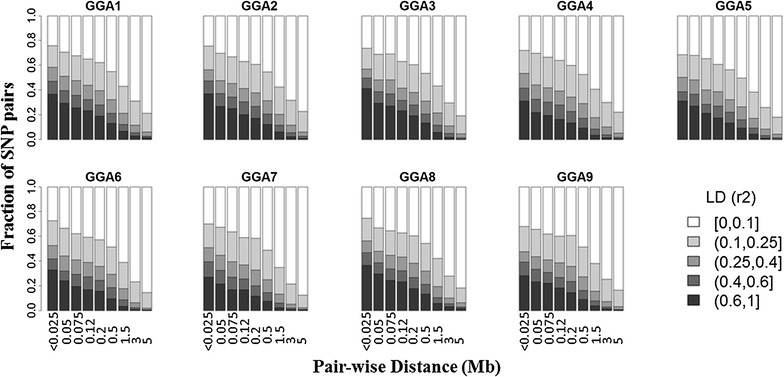
Fig. 1.

Linkage disequilibrium patterns. Level of linkage disequilibrium decay according to inter-SNP distance up to 5 Mb for the first nine chicken chromosomes (GGA1 to GGA9). The proportion of SNP pairs with different levels of linkage disequilibrium is shown for different distances between SNPs (in Mb) for the following bins (0, 0.025), (0.025, 0.05), (0.05, 0.075), (0.075, 0.12), (0.12, 0.2), (0.2, 0.5), (0.5, 1.5), (1.5, 3), (3, 5)
