
Fig. 3.
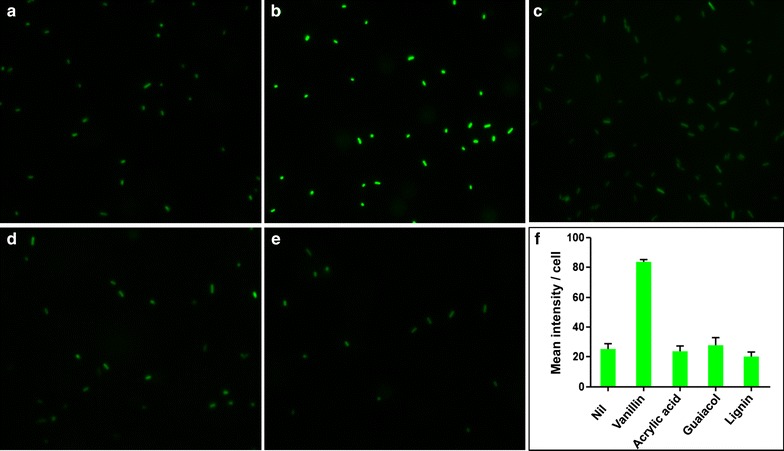
Fluorescence microscopy image of the VSC biosensor: a untreated and after treatment with 5 mM, b vanillin, c acrylic acid, d guaiacol and e 5 mg/ml lignin. Mean fluorescence of the cells was measured using ImageJ software and is presented in f. The cells were grown for 20 h in the presence of individual chemicals, and all the samples were imaged by fluorescence microscopy using same magnification and exposure times