
Fig. 4.
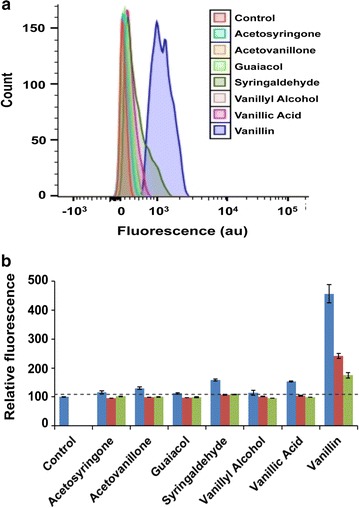
Response of the VSC biosensor to various lignin degradation products: a histogram of FACS-generated fluorescence measurement and b median fluorescence value (normalized) of the cells treated with 5.0 mM (blue), 1.0 mM (red) and 0.5 mM (green) of individual lignin degradation products. The dotted line indicates the significance threshold (fluorescence of the untreated cells +3 SD)