
Fig. 1.
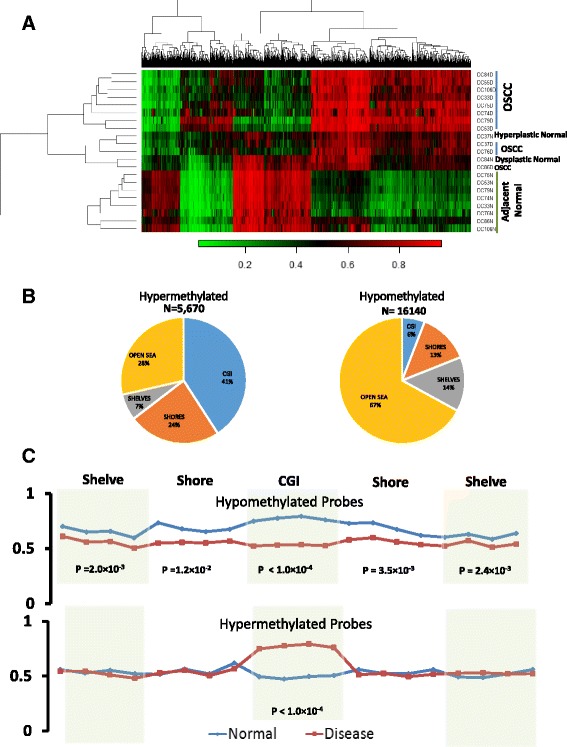
Distribution of differentially methylated probes (DMPs). a Heatmap of top 2000 DMPs. Hierarchical clustering showing separate grouping of DMPs for OSCC and adjacent normal tissue. b Genomic localisation of hypermethylated and hypomethylated probes at the CpG islands (CGIs), shore, shelves, and open sea. c Average methylation across the CGIs, shores, and shelves for hypo- and hypermethylated CGIs