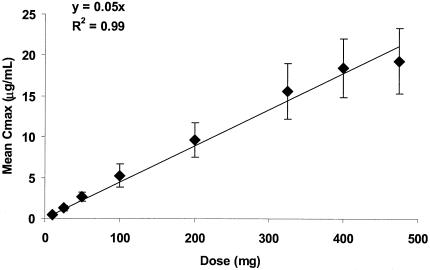
FIG. 6.
Relationship plot for Cmax versus dose following i.v. infusions of 10 to 475 mg of BB-83698 to healthy male volunteers. Data points represent, in order of increasing dose (10, 25, 50, 100, 200, 325, 400, and 475 mg), mean Cmaxs (±standard deviations) obtained at those dose levels. The solid line is the linear regression line predicted by the equation y = 0.05x (r2 = 0.99).

