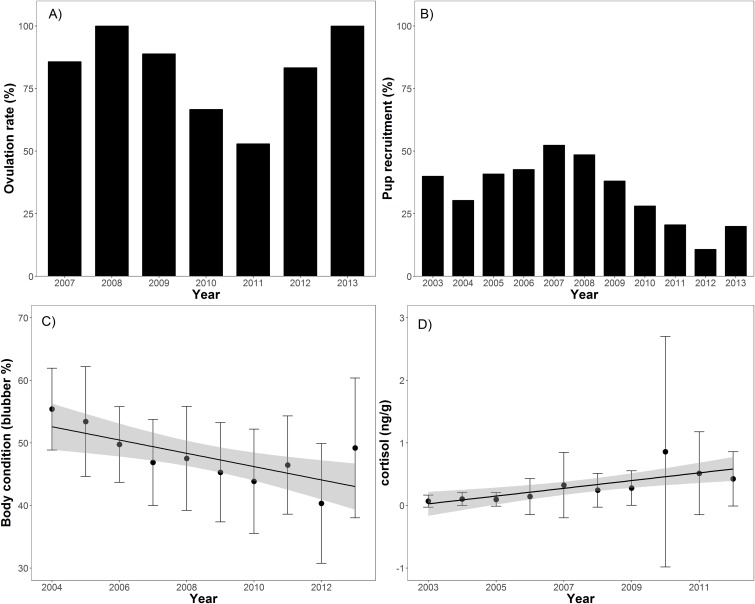
Figure 2. Barplots (A and B) of annual ovulation rates (%) from adult female ringed seals and annual percentage of pups in the harvest (Table 1).
Linear regressions between seal body condition and harvest year (C; slope = −0.01, t = −8.2, p < 0.001), and cortisol level and harvest year (D; slope = 0.02, t = 8.0, p < 0.001).

