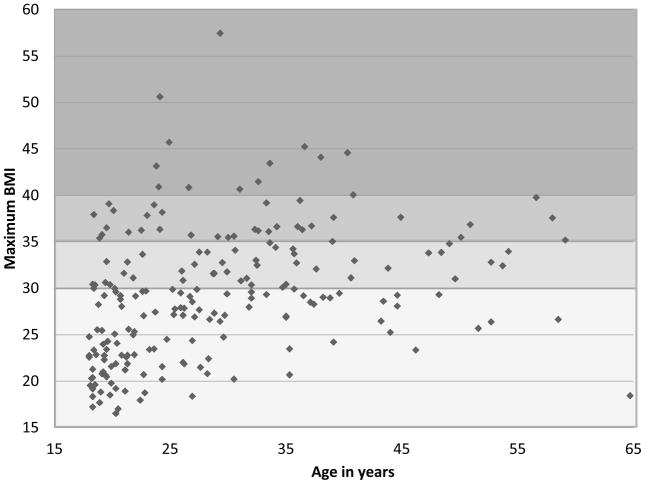
Figure 1. Maximum BMI in 207 adults with 22q11.2DS, by age.
Scatterplot of maximum BMI and age at assessment for 207 adults with 22q11.2DS. Colored panels from bottom to top indicate four BMI classes:14 not obese (green), class I (yellow), class II (yellow-orange) and class III obesity (orange). The “not obese” category includes eight subjects with maximum BMI <18.5 who would be considered underweight.

