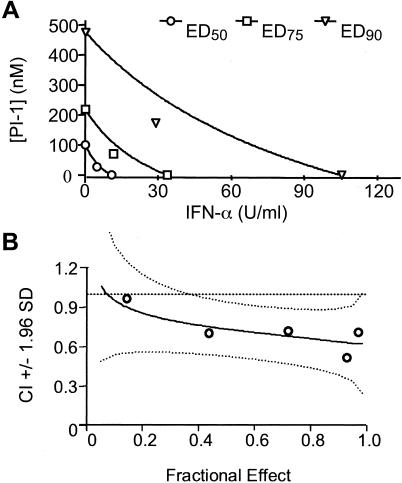
FIG. 5.
Analysis of the combination of PI-1 and IFN-α by use of the Loewe additivity model. (A) The data for the combination shown in Fig. 3A were also analyzed by using CalcuSyn program and are presented as a traditional isobologram, in which the lines represent the EDs of the two drugs required to achieve 50, 75, or 90% inhibition if the effects of the two compounds were simply additive. The dots are the actual experimental doses used to achieve those effects. (B) The CI can be calculated for each combination, as described in the Materials and Methods, and is plotted as the solid line versus the percent inhibition (i.e., the fractional effect). The 95% confidence intervals (1.96 standard deviations) of the CI are shown as two curved dotted lines. The theoretic additive effect (CI = 1) is represented by a straight dotted line.

