
Fig 1.
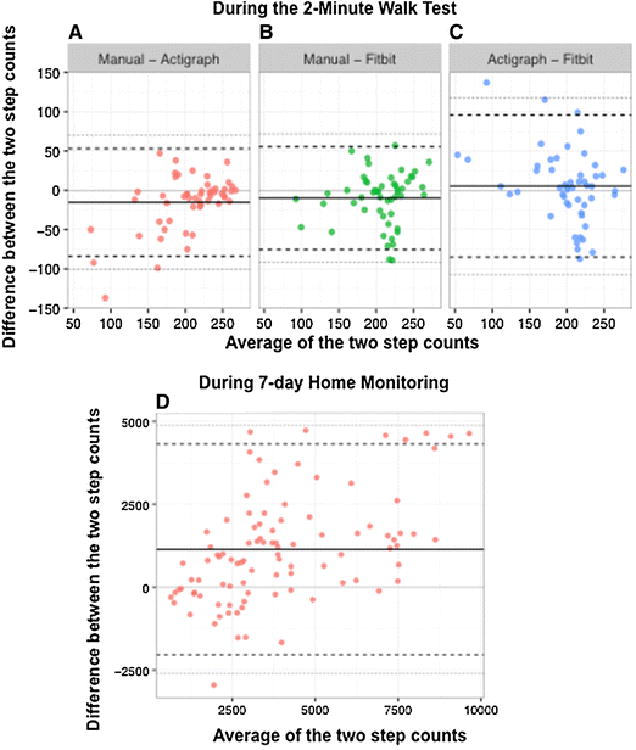
Bland–Altman plots to assess agreement between measurement techniques. a–c Comparisons of steps counted during 2-min walk test as recorded by manual counting, Fitbit Flex, and ActiGraph. d Bland–Altman plots for Fitbit Flex and ActiGraph steps per day as recorded over 7 days of activity monitoring in the home environment. The solid black line represents the mean difference between the measures and the black dashed horizontal lines represent mean difference ±2 standard deviations. Each point corresponds to a separate individual (a–c) and separate day (d). The solid lighter gray line indicates where ‘0’ difference between the measures would lie. The gray dashed lines are the 95% limits of agreement