
Fig 2.
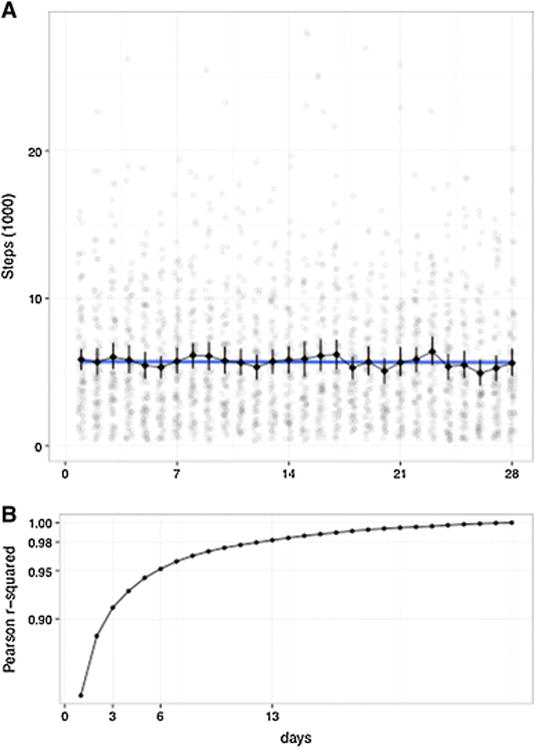
Evolution of daily step count and of the reliability of monitoring over 28 days. a Average Steps (via Fitbit Flex) per Day, over initial 28 days. The number of steps taken each day for each individual participant is represented in light grey dots. The black line depicts the average number of steps per day, across all participants, with the variability denoted by the error bars. No reactivity was observed in our cohort. b For each n number of days, we plot the average of all the correlation measures between an average daily step count computed from a monitoring period of n successive days, and the average daily step count computed from the full 4 weeks monitoring period (ground truth). The correlations are computed with the Pearson r2, across all patients