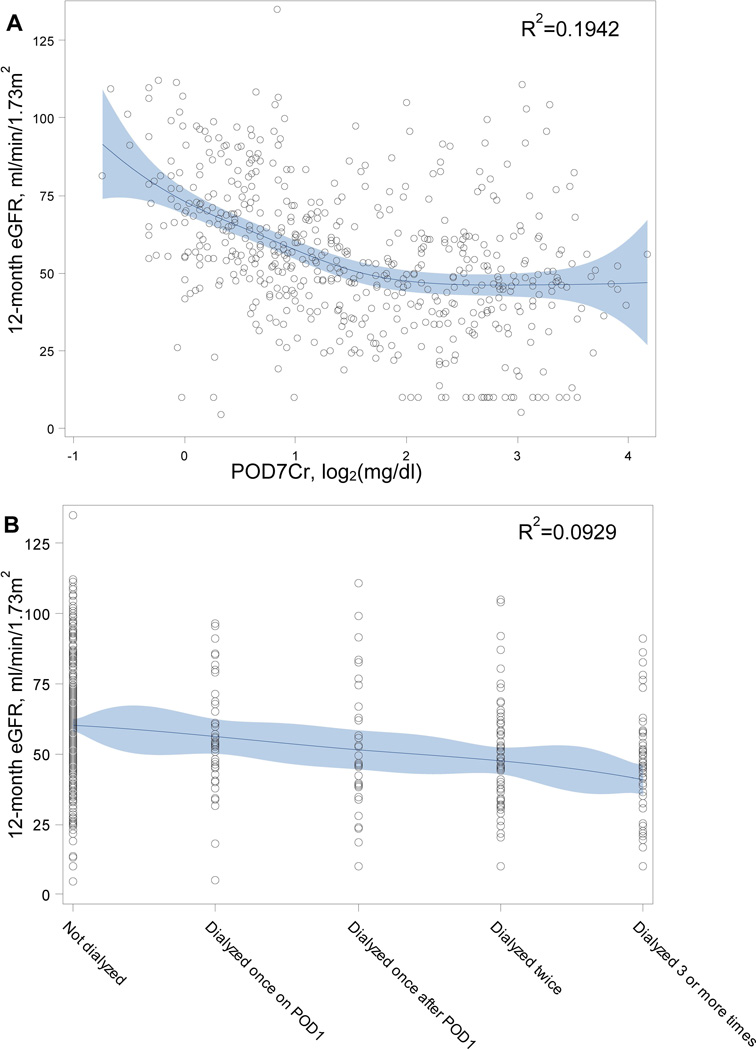
Figure 2.
Basis spline curves. A. 12-month estimated glomerular filtration reate (eGFR) vs. postoperative day 7 serum creatinine concentration (POD7Cr, log2-transformed). B. 12-month eGFR vs. number of dialysis sessions in the first week. Solid line represents the penalized basis spline curve fit with 10 knots and automatically selected smoothing parameter. Shaded area represents the 95% confidence limits.

