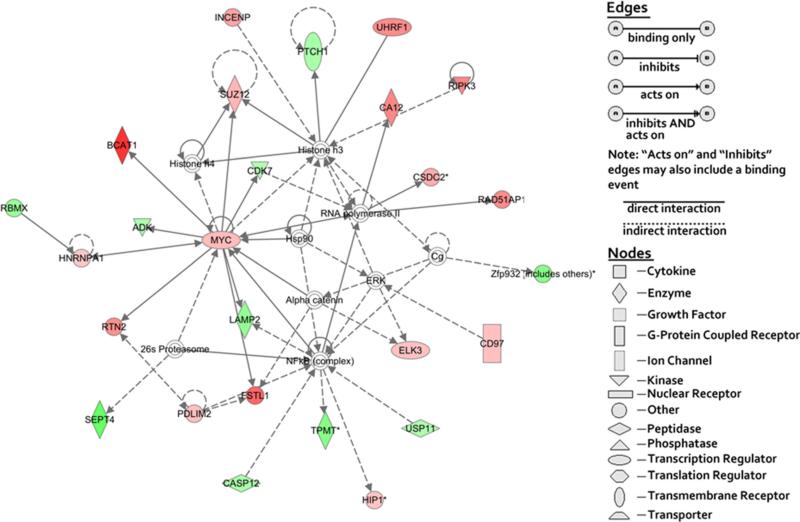
Fig. 3.
Network of the genes related with post-translational modification, cancer, and tumor morphology. Ingenuity® bioinformatics pathway analysis tool was used to build a gene network relative to post-translational modification, cancer, and tumor morphology by using all relevant genes listed from Tables 3 and 4. Symbols for genes representing specific categories of cellular molecules as well as interactive relationships are depicted in the legend. Color gradations are based upon gene regulation at the fold change level. Red color represents the genes overexpressed in highly aggressive ovarian cancer cell lines. Green color represents the genes overexpressed in moderately aggressive ovarian cancer cell lines. No color represents the genes that did not show any differences between two cell groups

