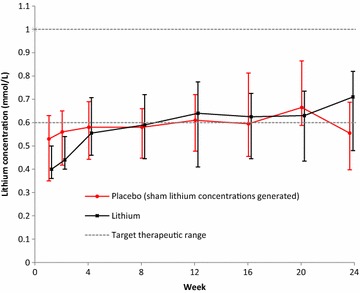
Fig. 1.

The graph shows the mean change in lithium concentrations. The bars indicate median and interquartile range change in lithium concentrations over the 24 weeks in the lithium and placebo arms respectively. Sham lithium concentrations were generated for the placebo arm. The broken line indicates the target therapeutic range of 0.6–1.0 mmol/L
