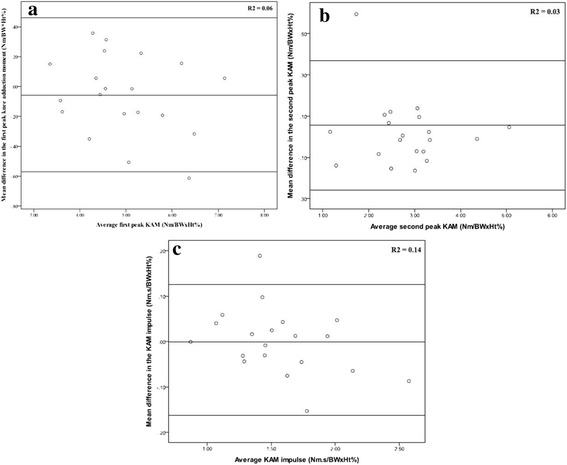
Fig. 2.

Bland Altman plots and the 95% limits of agreement for the (a) first peak knee adduction moment, (b) second peak knee adduction moment, and (c) the knee adduction moment impulse between conditions. The mean difference between conditions is shown on the Y-axis and the standard deviation of the difference is shown on the X-axis. Regression coefficient of proportional bias in data falling above or below the mean difference is shown inset
