Figure 3.
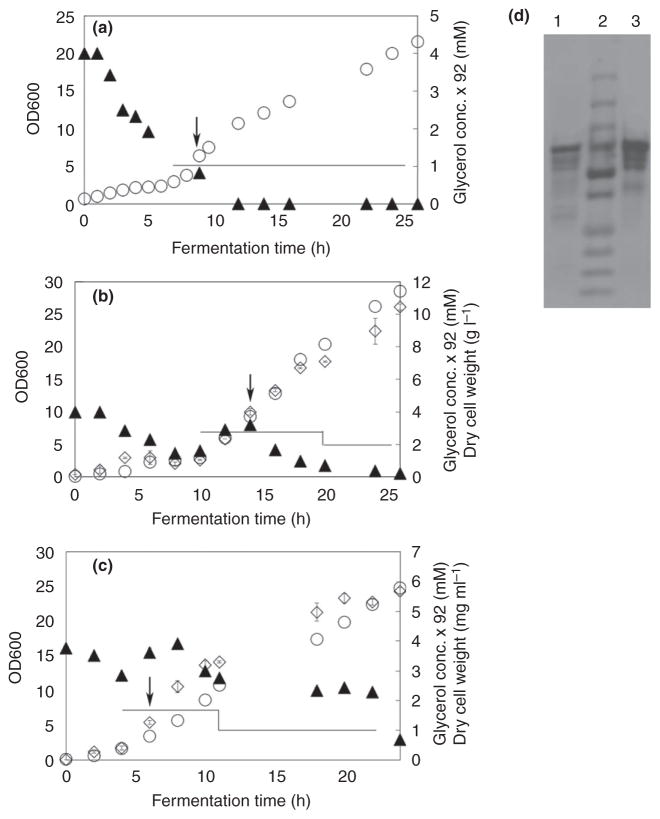
Escherichia coli 6-OST-3 fed-batch fermentation in glycerol and LB medium. Panels a, b and c show fed-batch fermentation profiles from batch a, b and c, respectively. Bacterial growth (empty circles), glycerol concentration (filled triangles), and dry weight of biomass (empty diamonds), feeding profile (lines). Induction was performed with 0·1 mmol l−1 IPTG at 7·5, 9·5 and 3·5 Abs600nm, respectively, as indicated by the arrows. d: SDS-PAGE analysis of purified enzyme; lane M, ladder as reported in Fig. 1; lane 1, purified enzyme from batch a; lane 2, purified enzyme from batch b; and lane 3, purified enzyme from batch c.

