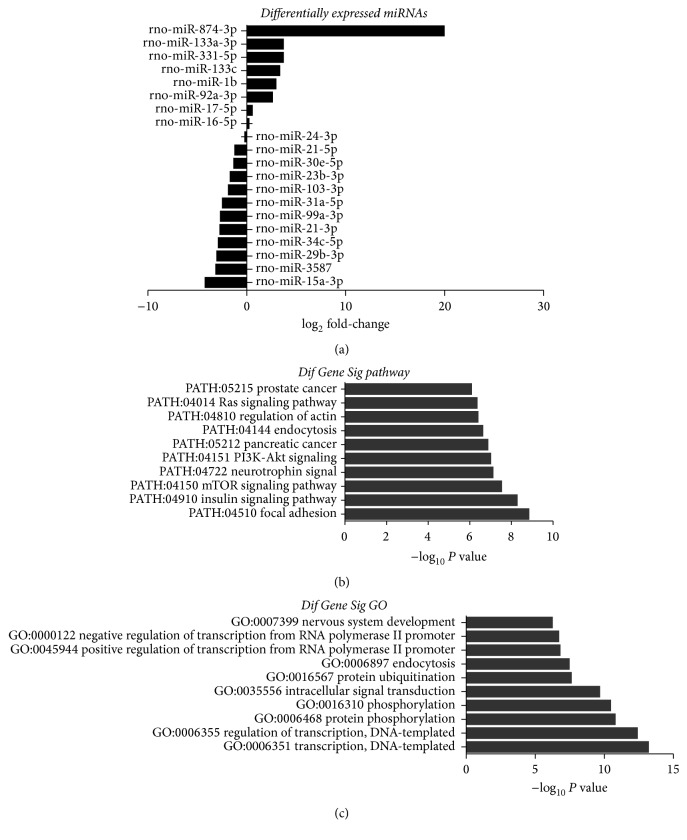
Figure 4.
Differentially expressed miRNAs, pathway analysis, and gene ontology (GO) in MSC-Exo compared with MSCs. (a) List of the differentially expressed miRNAs and the log2 fold-changes are indicated. (b) Pathways associated with increased expression of miRNAs in MSC-Exo. The vertical axis is the pathway category and the horizontal axis is the enrichment of pathways. (c) GO category associated with increased expression of miRNAs in MSC-Exo. The vertical axis is the GO category, and the horizontal axis is the enrichment of GO.

