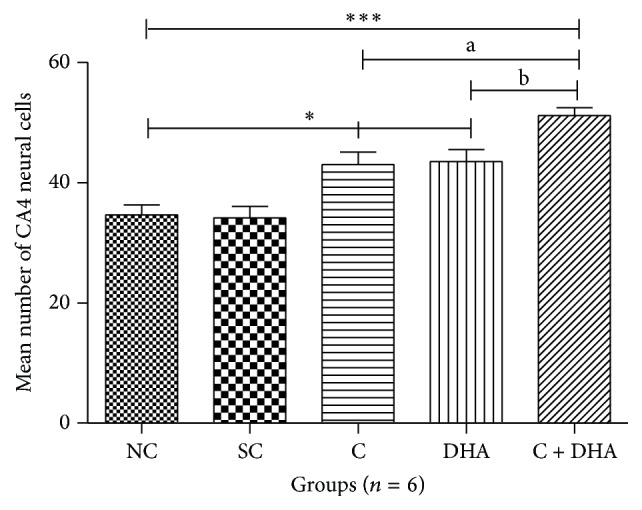
Figure 5.

Comparison of neural cells in CA4 region of 5 μ thick hippocampal sections. Mean number of neural cells ± Standard Error from 250 μm area of CA4 region of hippocampus from either side in normal control (NC), saline control (SC), choline (C), docosahexaenoic acid (DHA), and choline + docosahexaenoic acid (C + DHA) age matched group of rats. One-way ANOVA followed by Tukey's post hoc test. “∗”, NC versus supplemented groups; “a”, C supplemented group versus C + DHA group; and “b”, DHA supplemented group versus C + DHA group. ∗/a/bp < 0.05 & ∗∗∗p < 0.001.
