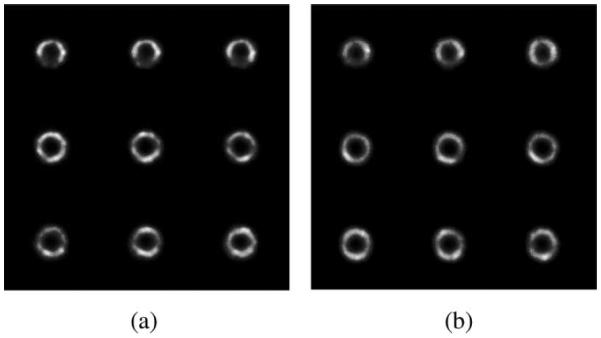
Fig. 12.

(a) 3-D image reconstructed from the low-count LEHR data with 3-D resolution compensation (OS-EM: eight subsets and three iterations). Each subfigure (in row order from top to bottom) represents a transaxial slice of the 3-D image (slice 60–68, respectively). (b) 3-D image reconstructed from the low-count LEHS data with 3-D resolution compensation (OS-EM: 8 subsets and 13 iterations). Each subfigure (in row order from top to bottom) represents a transaxial slice of the 3-D image (slice 60-68, respectively).
