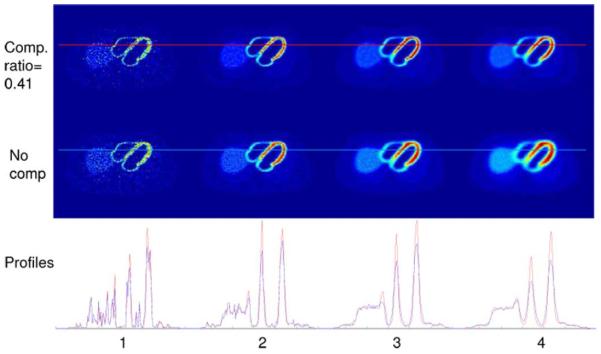
Fig. 3.
Images reconstructed with a compensation angle to hole angle ratio of 0.41 (first row) and without compensation (second row) from blurred simulations with hole angles equal to 1, 2, 3, and 4 times 3.1572°, from left to right, respectively. Images are all reconstructed with 200 iterations. Horizontal profiles of the reconstruction images with compensation (in red) and without compensation (in blue) are plotted in the bottom row. Red and blue lines in the reconstructed images indicate the locations of the profiles being plotted.

