
Fig. 6.
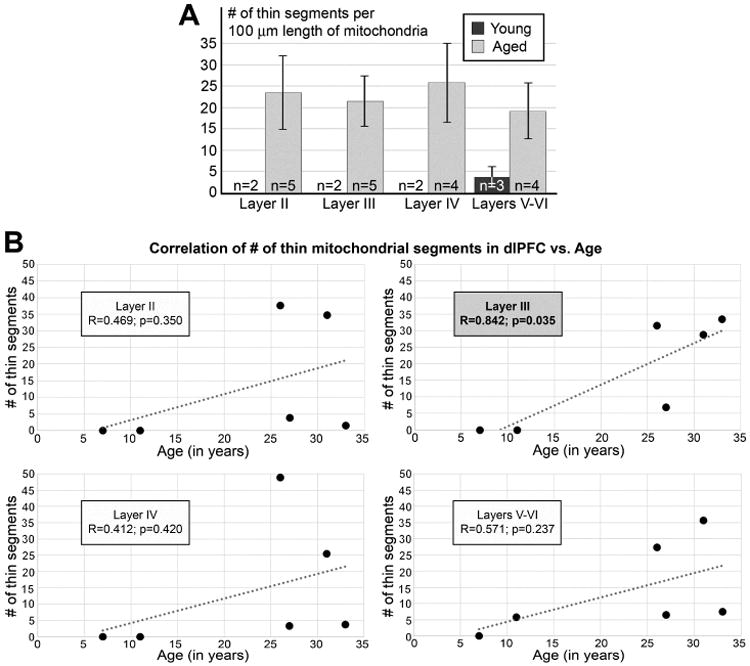
Laminar distribution of the number of thin segments normalized per 100 micron length of reconstructed mitochondria. (A) Average number of thin segments from four aged (26, 27, 31 and 33 yo; grey columns) and two young animals (7 and 11 yo; black column). In young animals, MOAS were identified only in layers V-VI, and were absent in the layers II-IV. Notice that the average numbers of thin segments are similar in all analyzed layers from aged animals. Error bars show SEM. n is number of neuropil segments analyzed. (B) Correlation of normalized number of thin segments in distinct layers during aging in the monkey dlPFC. Statistically significant correlation between MOAS and advancing age is seen only in layer III.