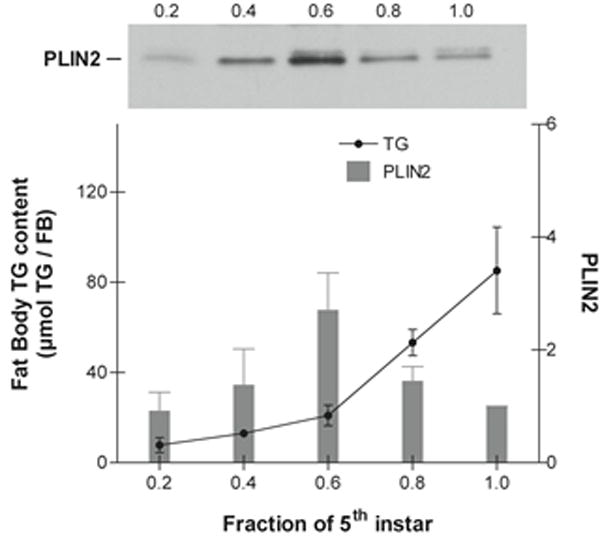
Figure 7. Protein levels of PLIN2 in 5th-larval fat body.

The protein level of lipid droplet-PLIN2 was determined by western blot analysis using ~20 μg of total protein as described in the Materials and Methods. PLIN2 levels from at least three independent sets of LD preparations were obtained. The data in the graph represent the PLIN2 levels (means ± SD) normalized to day 5. The age of the larvae is expressed as a fraction of the total length of the feeding period (5 days). A representative PLIN2 western blot image is shown in the figure. The content of fat body TG (mean ± SD, n=3) is expressed in μmol TG per FB.
