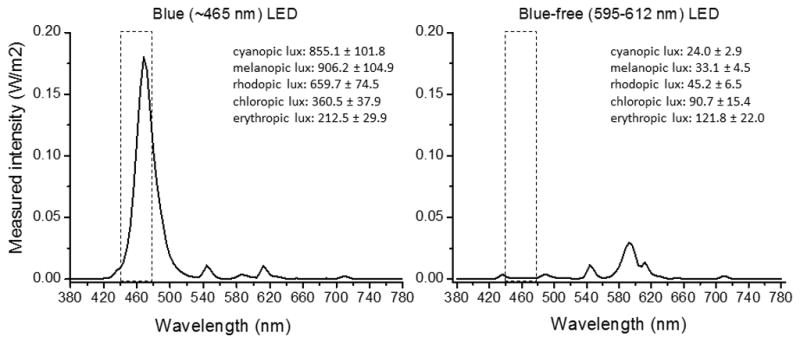
Figure 1.

The spectral distribution (measured intensity in W/m2) of the blue (~465 nm) and blue-free (595–612nm) LED devices used in the present study. The box outlines the differences in the two LED devices in the blue component. We report 5 independent irradiance measures (S cone, cyanopic lux; melanopsin, melanopic lux; M cone, rod, rhodopic lux; chloropic lux; and L cone, eryhtropic lux) across the blue LED (n=5 devices) and blue-free LED (n=5 devices) using the toolbox described in Lucas et al. (26).
